韦伯图,也称为蛛网图,是一种可以用来可视化函数  的连续迭代的图。 特别是,该图的线段连接点
  ,
,  ,
,  , .... 该图之所以如此命名,是因为其“锚定”到函数
  和
和  的直线段可能类似于蜘蛛网。 上面的动画显示了 Logistic 映射
  ,其中
,其中  的韦伯图。
的韦伯图。
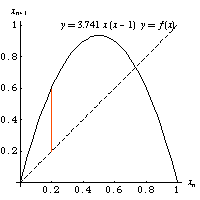
韦伯图,也称为蛛网图,是一种可以用来可视化函数 的连续迭代的图。 特别是,该图的线段连接点 , , , .... 该图之所以如此命名,是因为其“锚定”到函数 和 的直线段可能类似于蜘蛛网。 上面的动画显示了 Logistic 映射 ,其中 的韦伯图。
Weisstein, Eric W. “韦伯图。” 来自 —— 资源。 https://mathworld.net.cn/WebDiagram.html